Controller uses Azbil-original index to detect changes in the status of control equipment
Model C7 Multi-Loop Controller with Multifunction Display
For use with semiconductor-manufacturing and food-processing equipment, among others, we have developed a new controller, model C7, that maintains a consistent temperature within a loop. In spite of its compact frame, the C7 controls as many as four systems simultaneously. For superior usability, the display unit is separable from the main unit and features a touch panel color LCD for ease of use and high visibility. In addition, we have developed a health index function[*1] that uses sensing data and control signal (M.V.) amplitude to quantify changes in control loop behavior. This provides advance warning of equipment problems, allowing timely preventative maintenance.
[*1]Diagnostic indicator for prediction or detection of production equipment failure
Background and Needs
The C7 multi-loop controller with a multifunctional display
Good temperature control in storage, manufacturing, and processing is essential in creating uniform and homogeneous products. For manufacturing sites that handle chemical products and organic solvents, temperature control can be a key component in ensuring safety.
The type of equipment responsible for this vital function is called a temperature controller or simply a controller. Its main purpose is to receive data input from devices such as temperature sensors, pressure sensors, and flow rate sensors and to output control signals to heaters or valves so as to maintain a preset temperature range. Controllers are used in manufacturing equipment and control systems in various industries, such as semiconductor manufacturing, food processing, injection molding, oil refining, and pharmaceutical manufacturing.
In keeping with its achievements in measurement and control technology over the years as a supplier of controllers, particularly for the makers of manufacturing equipment, in March 2016 Azbil announced the development of the revolutionary C7 controller (Fig. 1). In addition to incorporating temperature control capabilities for a maximum of four systems (four feedback loops) in a compact case, the controller features a health index function that gauges the soundness of connected equipment.
Visibility and usability have been improved compared with previous models through the use of a touch panel color LCD on the display unit. For more flexible installation, the display unit can be separated from the main unit. Also, for ease of wiring, the main unit has spring-type terminals for convenient, secure, screwless connections. The controller is fully equipped with advanced features, such as fast 10㎳ control speed (previous models maxed out at 25㎳), a block structure to ensure maintainability and functionality, Ethernet (Modbus/TCP) connectivity, and a logging function for process data and control output.
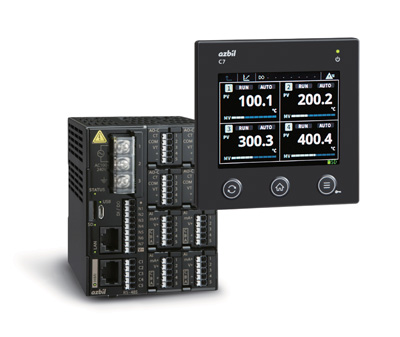
Figure 1. C7 multi-loop controller with multifunction display
Key Innovations
Enhanced visibility of problems by quantifying control loop fluctuation
One of the C7’s new functions is its health index. In recent years there has been a trend towards developing equipment that employs sensors in various positions to monitor status and collect data. This data is then analyzed to optimize operation, or for early detection of abnormalities. Known by various names such as Industry 4.0, smart factories, or industrial IoT (Internet of Things), this trend is a part of a larger movement towards a new way of operating industrial factories and plants.
The health index is a diagnostic indicat or designed to detect abnormalities and failures by predicting them at an early stage. It has the following features.
- IoT technology is generally used to detect various abnormalities in peripheral devices and equipment such as heaters and valves. What makes the health index distinctive is its ability to calculate a quantitative index representing the behavior of an entire control loop related to temperature control. By observing changes in this index over time, the status of the entire control loop-whether it is healthy or abnormal-can be understood.
- The health index is calculated using only the sensing data collected by the C7 and the amplitude of the control output from the C7. There is no need to connect sensors to surrounding devices and equipment (e.g., heaters and valves) or to run additional wires.
- Unlike existing IoT technology, sensing data is not collected by a host system via a network, but is instead calculated and processed internally by the C7. This eliminates the need to install a new network or to create an analytical application on a host server or in the cloud, although it is of course possible to transmit the index from the C7 to a host system via a network if necessary.
The health index is calculated using the formula shown in Figure 2. Various types of index could be made to show the health of a system, but the health index we developed and incorporated into the C7 is a step ahead of the competition because it uses an indicator called “normalized responsiveness” that equals the process gain Kp divided by the time constant Tp. In simpler terms, normalized responsiveness is a numerical representation of the amount of variation in the process.
With normalized responsiveness, even slight variations in the current temperature or in the control output, which would be difficult to discern on a graph, can be captured, as shown in Figure 3 with the numerals 0.050, 0.048, 0.046, and 0.044. As a result, changes that occur in any equipment or device related to the control loop (e.g., heaters or valves) can be detected quickly.
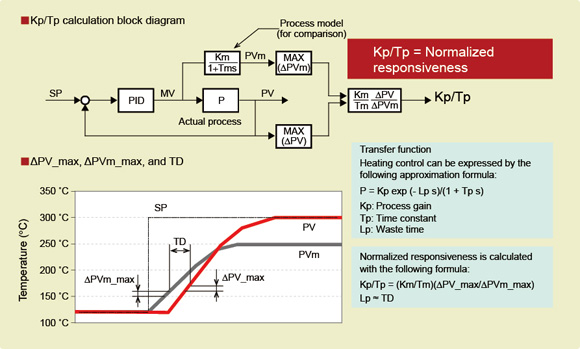
Figure 2. Health index calculation algorithm
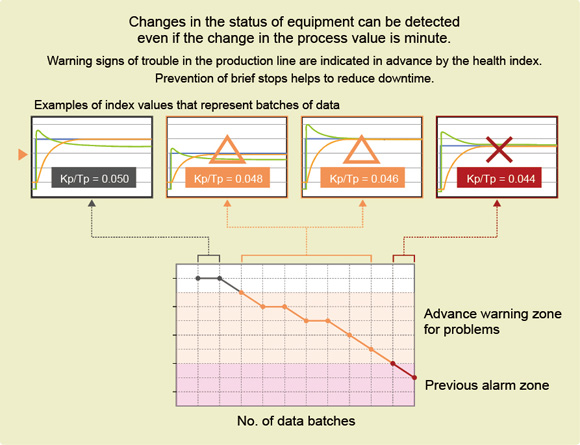
Figure 3. Detecting changes in the control loop using health index
Touch panel color LCD provides improved usability
In keeping with its corporate philosophy, Azbil pursues the goal of “human-centered automation.” As part of that effort, we strive to provide easy-to-use devices and equipment.
In the case of the C7 controller, we chose a touch panel color LCD for the display unit. The C7 has been well received by customers for its ease of use, because settings can be changed while looking at the indications on the display.
Since the touch panel is the resistive film type and has IP67 waterproof and dust-proof performance, it recognizes touches even when the user is wearing gloves, and it can be operated by users with wet hands.
The touch panel can also show the status of up to four loops at once by dividing the screen horizontally and vertically. If there is a problem, the display of the relevant loop is highlighted in red and its visibility is increased to make it noticeable at a glance from a distance.
The display unit is physically separable from the main unit and can be installed up to 30 meters away (up to 100 meters away using a separate power source), facilitating highly flexible installation in control systems and manufacturing equipment. For example, it is easy to place the main unit on the back side of a piece of equipment and the display on the front.
Also, in cases where a controller is installed in the door of a panel that opens, many cables for sensors and operation signals are usually clustered around the hinge of the door. In the case of the C7, the main unit and display unit are connected by a single cable, which reduces the number of wires near the hinge.
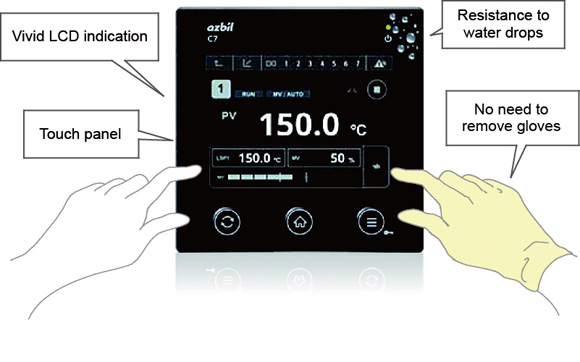
Figure 4. Equipped with a touch panel color LCD
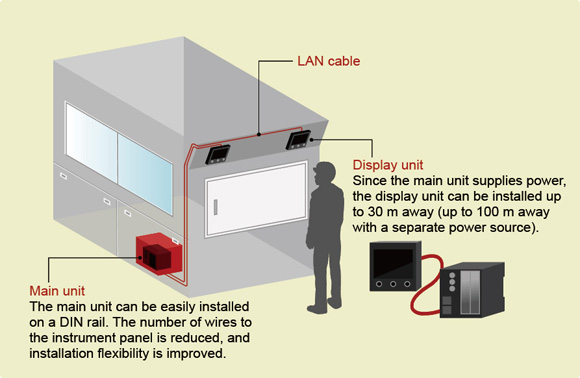
Figure 5. The main unit can be separated from the display unit(s), affording a high degree of flexibility in installation.
Results and Future Prospects
Data processing by equipment can achieve local computing
As previously mentioned, there are many IoT approaches underway to realize various types of visualization by means of sensing devices and equipment in factories and plants, together with data collection in the cloud. Some problems, however, can be expected. Sending a large amount of sensing data into the cloud will require significant network bandwidth and will increase the processing load in the cloud.
To get around these problems, architecture that can reduce traffic has been proposed, such as edge computing or fog computing, in which there is intermediate processing by IoT gateways or the like.
As an alternative, Azbil proposes local computing to further flatten the hierarchy by having sensing data processed by the field equipment itself.
The health index in the C7 can send sensing data to the cloud as-is for processing, but if data transmission intervals are lengthened in order to reduce network traffic, it will not be possible to precisely grasp fast changes in behavior such as those that can occur in manufacturing equipment.
With local computing, however, calculations can be made without concern for network traffic, at the time and under the conditions that are optimal for the sensing targets and analytical procedures.
Going forward, Azbil will suggest to customers that factories and plants be made smarter by integrating, as needed, architectures such as local computing.
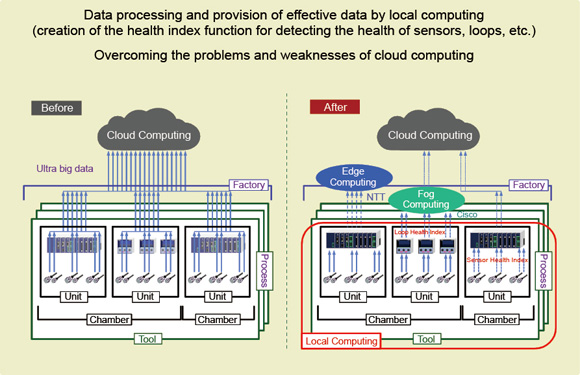
Figure 6. Local computing with equipment-side processing
*Handling of products and services described in “azbil techne” may differ by country or region.