Online Anomaly Monitoring System Using Factory Big Data
Early warning of problems with facilities, processes, or quality
This online anomaly monitoring system uses IoT and machine-learning technology to monitor the overall state of processes and equipment running in plants and factories. Its machine-learning function uses a fuzzy neural network to recognize normal states from long-term operational data. The system then compares, in real time, data obtained during current operation with the previously learned states, in order to quickly detect signs of a problem. The system improves the accuracy of process and equipment condition monitoring and helps plants and factories to maintain stable, safe operation.
Background and Needs
Using the IoT and machine learning to detect early signs of equipment problems
At factories and plants, various types of equipment operate in a complex, interrelated manner. To maintain stable and safe operation, equipment must be run constantly without problems. However, wear, dirt, corrosion, the end of a part’s service life, or some chance event may cause a breakdown, leading variously to suspended operation, degradation of product quality, or even an accident.
To prevent these scenarios, maintenance and management of equipment and facilities is very important. Periodic inspection and maintenance, which is called “time-based maintenance (TBM), is generally performed to prevent trouble.
Conventionally inspection and maintenance is carried out by humans. However, recent advances in IT technology support a more sophisticated approach in which data relevant to the state of equipment is sensed and analyzed, allowing problems to be detected at an early stage so that appropriate measures can be taken.
This approach is based on evaluation of the condition of equipment and is therefore often called condition-based maintenance (CBM). It is expected to become more widespread in tandem with “Industry 4.0,” the fourth industrial revolution, and “Industrial IoT” (IIoT), the industrial version of the Internet of Things (IoT).
In consideration of these trends in data-driven manufacturing control for factories and plants, Azbil developed its online anomaly monitoring system (released in July 2015) for the detection of equipment problems at the stage in which the signs appear, based on IoT and machine-learning technology (Fig. 1).
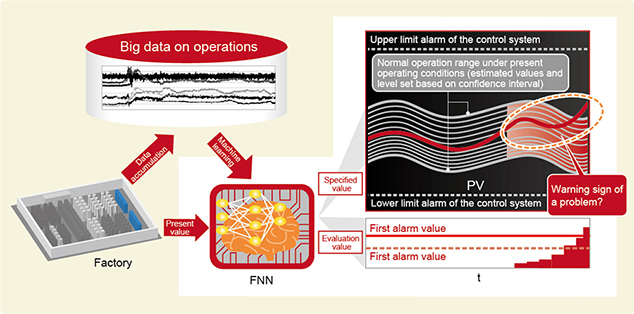
Figure 1. Azbil’s online anomaly monitoring system, which detects deviations from normal states by analyzing operating data based on machine learning.
The system is characterized by its use of a fuzzy neural network (FNN), one approach to machine learning. After learning to recognize normal states from accumulated facility operating data, it uses this data for comparison in order to quickly detect slight problems that people or conventional monitoring systems are not capable of noticing. This allows corrective measures to be taken more quickly (Fig. 2).
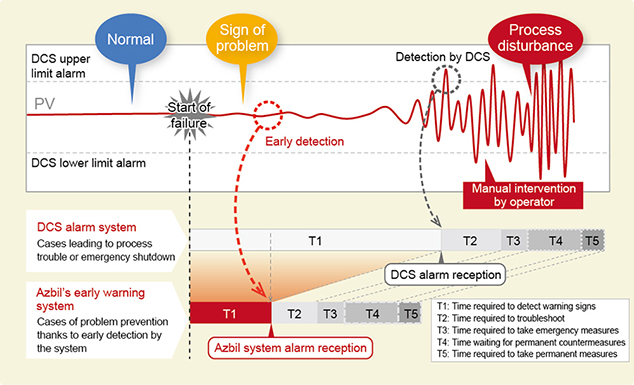
Figure 2. Detection of anomalies when warning signs appear, with the aid of machine learning based on an FNN, before an actual problem with operation can develop.
Key Points for Development
Evaluating operation in an analog manner using a fuzzy neural network
The number of solutions for facility problem detection that employ analysis of sensed data is increasing with the spread of the IoT. In addition, solutions based on machine learning are now appearing.
In many approaches, however, a specific amount of deviation from a normal state is judged to be a sign of a problem. This approach has drawbacks that are illustrated by the following examples. When the range of deviations (the gap between the upper and lower limits) is made narrower, the number of false positives (erroneous detection) increases. By contrast, when the range of deviations is made wider, the number of false positives decreases, but the sensitivity of actual problem detection also decreases.
To eliminate these problems, Azbil uses the FNN, which is based on “fuzziness,” a concept for dealing with ambiguity, for machine learning of normal states and detection of abnormal states (Fig. 3).
In the online anomaly monitoring system, the FNN “studies” the accumulated normal operating data (data for approximately several weeks to several months of operation) by first reading it as explanatory variables. The system thereby obtains a range of values that can be regarded as normal. This range is used as an interval of estimated values.
The aforementioned operating data refers to data consisting of measured values that change with time, such as ambient temperature, liquid temperature, pressure, valve travel, flow rate and line speed, and pH. Learning focuses only on the relationship of individual data items without considering their meaning. Accordingly, the types of sensors, facilities, equipment, and target process used do not matter.
Next, data transmitted from sensors and facilities in real time is compared, as objective variables, with the estimated values obtained in advance. Evaluation values are then calculated in an analog manner analogous to human judgment, such as “this value falls within the learned interval of estimated values (range of normal values) but slightly deviates from the median, and the deviation increases with time while fluctuating unstably.” Evaluation values are displayed on the screen of an administrator.
The early-warning system is based on an FNN and characterized by the fact that it can accurately detect signs of problems at a very early stage compared to a conventional simple judgment as to whether a value falls between the upper and lower limits.
The system allows the range estimated by learning (interval of confidence) to be periodically updated based on, for example, the previous day’s operating data. Thus, the latest “correct state” can be maintained.
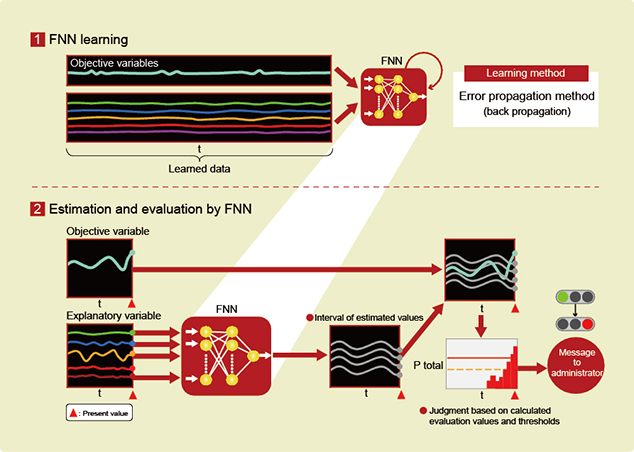
Figure 3. General operation of the FNN and calculated evaluation values (red graph)
Easy-to-understand user interface design
When viewer terminals (PCs) for the system are installed at a process automation or factory automation site, workers who are not specialists in fields like machine learning must be able to accurately understand the status of process equipment and the status of problems. For this reason, the user interface of this system has been designed to be easy-to-understand and easy-to-distinguish visually.
Specifically, we have adopted a design similar to that of typical DCS (distributed control system) screens widely used at such sites. For example, the “trend monitoring view” displays not only the disturbance variables for temperature, etc., set points (SP), process variables (PV), and estimated values, which indicate the correct state and present state of the monitored equipment, but also “evaluation values” indicating any deviation from the estimated values obtained by the FNN. These displayed values enable workers to identify signs of problems quickly (Fig. 4).
In addition, the configurator screen for enabling FNN learning of existing operating data and for changing various settings has a simple structure. On this screen, it is easy to request data correlations and the like. Users of the system for onsite data analysis give it high praise for ease of use.
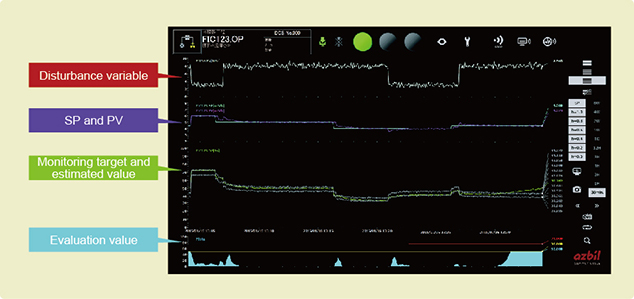
Figure 4. Easy-to-understand screen design
Results and Future Prospects
Verification that warning signs can be detected several hours to several months in advance
Azbil’s online anomaly monitoring system is suitable for use in environments where equipment data can be collected continuously, such as plants and mass-production lines.
As of January 2017, we provide package licenses for either 100 sensors or 400 sensors. As described above, we recommend using appropriate time-based maintenance plus highly accurate condition-based maintenance. We also offer technical consultation on IoT that can be implemented by introducing sensing functions into existing facilities.
Verification performed in cooperation with chemical plants and other companies have demonstrated that the system was able to detect a flowmeter problem due to nozzle clogging 5 hours and 30 minutes before an administrator judged it to be a problem (Fig. 5). In addition, it was able to detect signs of a problem in a steam-adjusting control valve several days before a failure occurred. These examples verify the effectiveness of the system (Fig. 6).
Parts replacement and other measures implemented when warning signs are detected will prevent plant and line downtime, minimizing losses. Such measures will also lead to the prevention of the worst-case scenario, workplace accidents.
The system has been confirmed to be effective not only in detecting equipment failures but also in detecting signs of problems in processes and quality that directly affect corporate profits. We will further expand its applications in a variety of areas.
IoT and machine learning have been drawing much attention as technological keywords, but they have only just begun to come into full-scale practical use. Azbil is working to train personnel with high-level specialization in data analysis in order to further contribute to the progress of plant and factory automation.
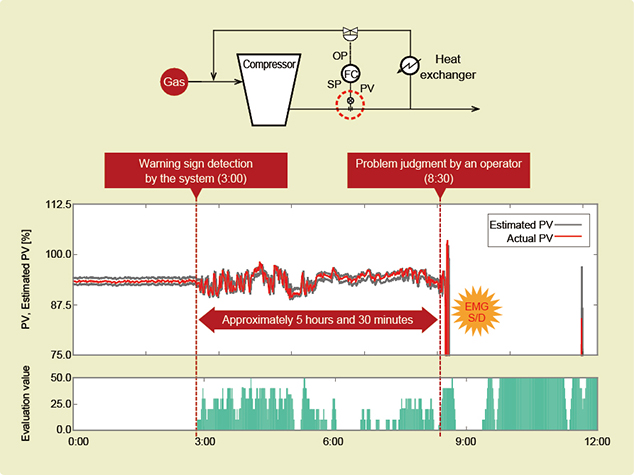
Figure 5. Example verifying that warning signs of a flowmeter problem can be detected by a rise in the evaluation value more than 5 hours before the operator notices it.
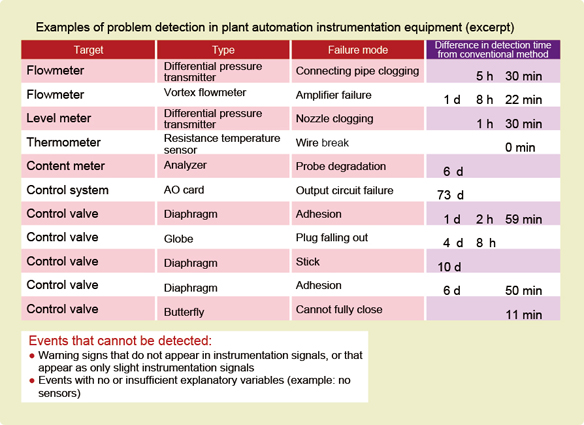
Figure 6. Examples from a simulation using data from actual process automation operation
*Handling of products and services described in “azbil techne” may differ by country or region.