Energy Management and Analysis System
HOME > Case Studies > DIC Corporation KASHIMA PLANT
DIC Corporation KASHIMA PLANT
DIC Corporation is the largest manufacturer of printing ink (ink for the printing industry) in the world. When the Great East Japan Earthquake led to shortages of electric power, DIC’s Kashima Plant turned the adversity into an opportunity to install a system to visualize consumption of power and energy. The system allows all plant employees to see information about their energy consumption at any time. It is steadily raising employees’ consciousness about energy conservation, helping to reduce costs through the visualization of per-unit energy consumption, and prompting employees to think about quality improvement.
DIC Corporation KASHIMA PLANT
Factories and Plants Chemicals Energy Efficiency Industrial Automation Control and Monitoring Systems and Software
Products/Services Provided
Post-earthquake shortages seen as an opportunity, underscoring the need to save energy every day
DIC Corporation was founded in 1908 for the production and sale of printing inks. Committed to its management vision, “Color & Comfort by Chemistry,” the company delivers color and pleasantness to people in their daily lives through its four core business operations. Printing Inks is DIC's mainstay business since its establishment. As a global market leader, DIC boasts an extensive product portfolio ranging from publishing inks to inks and adhesives for packaging, enabling it to respond to the needs of customers worldwide. Starting with the organic pigments and synthetic resins that are the principal raw materials for Printing Inks, the company expanded to supply the Fine Chemicals used as raw materials in digital printing equipment, and through its Polymers business offers synthetic resins and related products for a wide range of industrial fields. In addition, the company combines various fundamental technologies to create and offer application products through its Application Materials business.
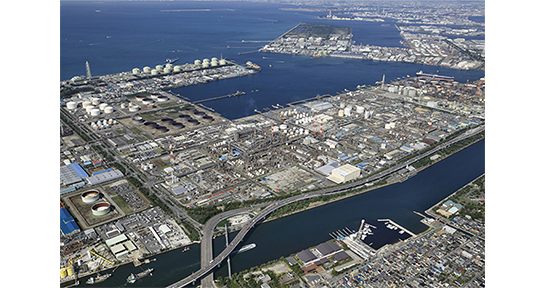
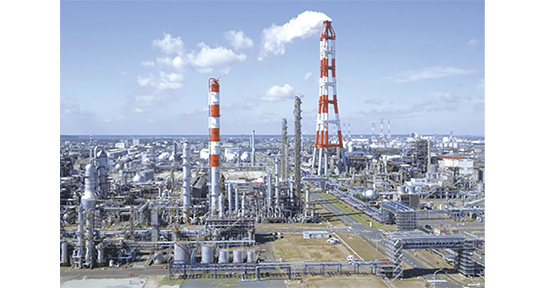
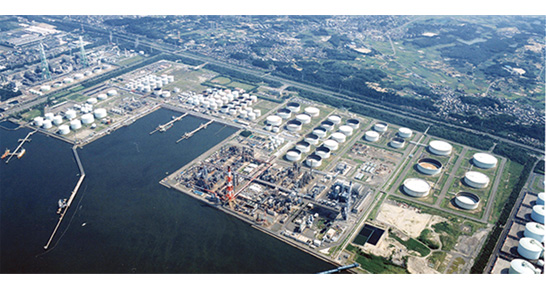
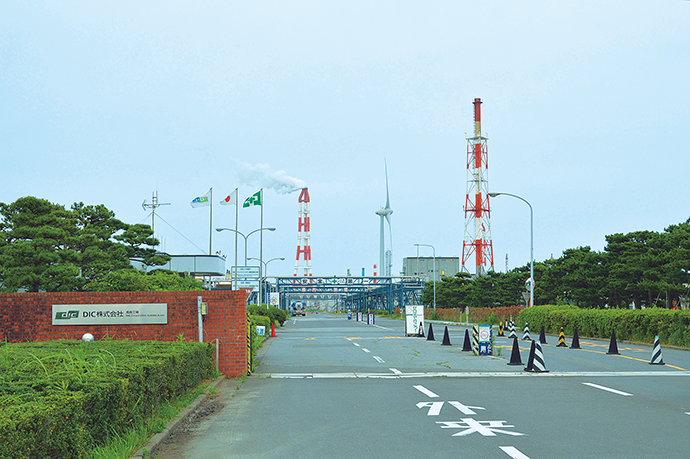
The Kashima Plant is DIC’s main factory. It manufactures primarily organic pigments, offset inks, additives, and PPS (polyphenylene sulfide) resin. This plant has been actively addressing energy conservation for many years by utilizing woody biomass*1 power generation and wind power generation, for example.
“Energy conservation is an important issue for us not only in response to society’s demand to reduce the burden on the environment, but also to decrease manufacturing costs,” explains General Manager Toshikazu Adachi. “Our plant consumes large amounts of energy for producing products. Faced with critical shortages of electric power in the summer of 2011 in the wake of the Great East Japan Earthquake, we came to a fresh realization of the importance of understanding our daily energy consumption and furthering our energy conservation efforts.”
*Within this article, as of March 2014, products and services that are sold only in Japan is included.
By means of simple and colorful screens, easy-to-understand information for everyone
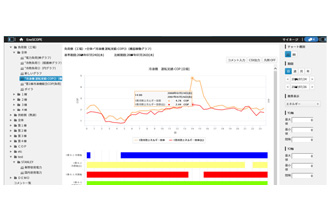
The EneSCOPE screen shows the amount of energy consumed by individual production lines in different colors. This information can be freely viewed by all employees on their PC via the plant intranet.
With that motivation, DIC’s Kashima Plant decided to install a system that would make energy consumption easy to see and understand. After comparing the products offered by a number of companies, DIC chose the energy visualization solution proposed by Azbil Corporation, consisting mainly of its energy management system, electricity use optimization package, and energy key indicators package (called EneSCOPE, ENEOPTpers, and ENEOPTtopview respectively in Japan).
The question, “Visualization for whom?” was the reason for selecting Azbil, according to Power Supply Group Leader Satoshi Abe. He explains, “To promote electricity and energy conservation throughout the entire plant, we needed to show energy consumption data not only to the group in charge of the power supply, but also to the employees on the production floor and to office workers at the plant. Azbil’s products have simple and colorful screens that make it easy to understand the displayed information, and they also show energy consumption trends by department in real time, regardless of how small or large the amount is.” Satoshi Hirano of the plant’s Power Supply Group adds, “At first we worried that Azbil products might not be able to utilize the data collected by another company’s DCS*2, but of course Azbil had the technical expertise to implement the visualization.”
The Kashima Plant accepted Azbil’s proposal in February 2012, and in June of the same year the visualization system using EneSCOPE and ENEOPTpers began operation. Visualization of energy at the plant is unfolding according to a roadmap that specifies the following five steps: (1) establish a committee to promote energy conservation, (2) visualize electric power and steam data by installing an appropriate system, (3) visualize data for water supply, instrumentation air, waste water, etc., (4) visualize per-unit energy consumption by product 3, and (5) visualize production information. Currently, the plant is implementing Step 3, and for some production processes, pilot activities for Step 4 are underway.
In Step 1, according to Mr. Hirano, an Energy Conservation Promotion Committee was organized with the manager of the Kashima Plant as the committee chair. Committee leaders and members were selected from the employees of each group and from the production field. This committee reports on various activities conducted in the field in a monthly committee meeting and in an information bulletin, “Kashima Energy Conservation Communication,” published by committee members. Also in this step, grass-roots energy conservation activities among general employees began to blossom.
In Step 2, EneSCOPE and ENEOPTpers were installed, enabling anyone to freely view visualized energy information on PCs in the plant via intranet. As Mr. Abe describes it, “The top page, which is from ENEOPTtopview, gives a graphical bird’s eye overview of the entire plant. When you select a location on this screen, the display switches to an ENEOPTpers screen, and you can see the power usage situation for the selected location. Then, if you switch to the EneSCOPE screen, you can see detailed per-unit power and steam consumption trends.”
During lunch break, a large monitor installed in the cafeteria displays “Kashima Energy Conservation Communication,” the publication produced by the committee members. This draws employees’ attention to daily powerand energy-saving activities and motivates them to further conserve electricity and energy.
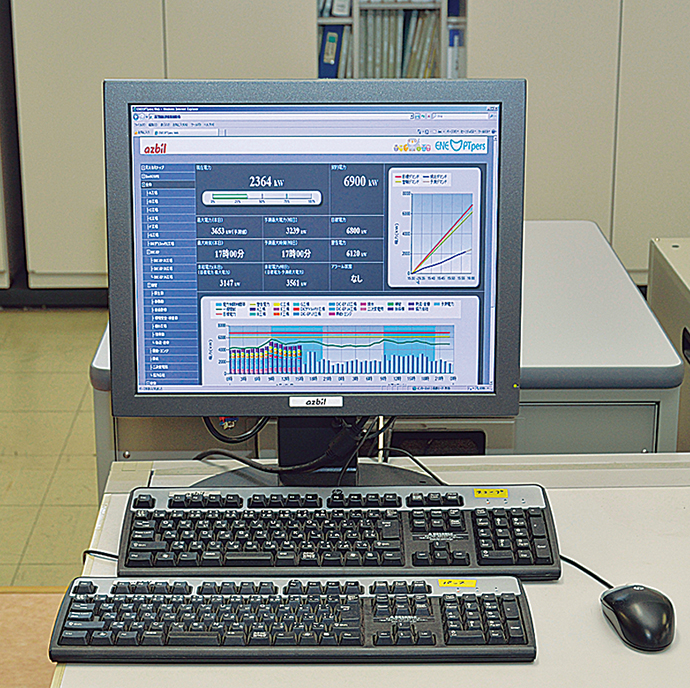
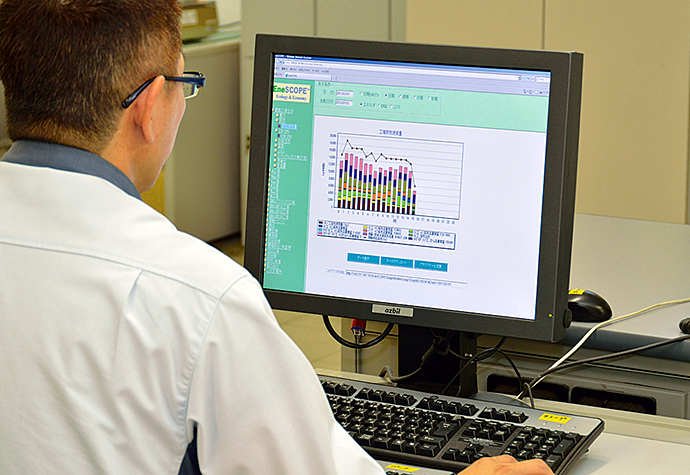
ENEOPTpers graphically displays power consumption trends by department on a PC set up in the power supply control center.
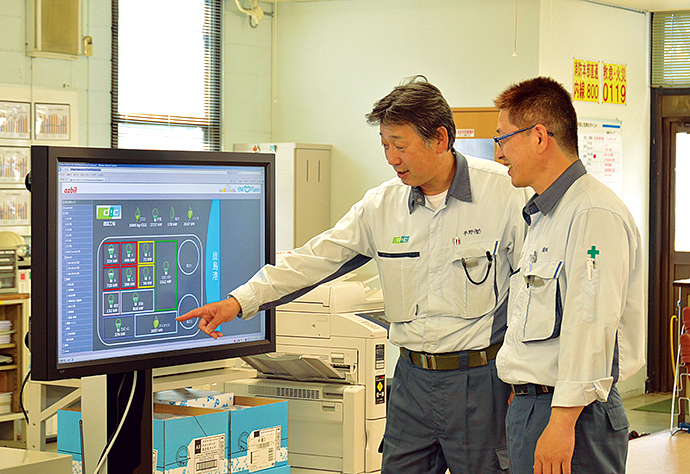
The dashboard-style screen of ENEOPTtopview shows a bird’s eye view of the entire plant as well as the amounts of electric power used by individual facilities on the premises. Selecting a location on the screen switches the display to an ENEOPTpers or EneSCOPE screen that displays more detailed information on energy usage.
Visualization produces steady progress towards achieving energy-saving goals
At the Kashima Plant, the energy-saving activities based on the visualization of energy consumption are producing results in the form of decreased consumption of electric power and energy.
“Our initial targets were a reduction of 3% in the per-unit electric power consumption rate by the manufacturing departments and a reduction of 3% in total electric power use by assisting departments from the levels in 2010,” says Mr. Abe. “The results obtained during the summer period of July to September 2012 indicated a 7.1% reduction by the manufacturing departments and an 11.0% reduction by the assisting departments. In the winter period from November to February, the manufacturing departments achieved a 6.4% reduction and the assisting departments attained a 27.2% reduction. These results exceeded our targets by far, so we are really able to see the effects of visualization.”
“The most significant result,” comments Mr. Adachi, “was that employees became more aware of their responsibility to conserve electric power and energy. I believe this is due to the display system, which allows all employees to view energy consumption information from a viewpoint that is relevant to their work. To further extend our energy-conservation efforts, we plan to visualize per-unit energy consumption by product in order to motivate all employees towards further cost reduction and quality improvement. For that effort, we will be counting on Azbil for continuing support as our partner in power and energy conservation.”
glossary
*1 Woody biomass
Woody biomass is mainly tree residue. Biomass power generation uses steam and gas produced by the burning of biofuels derived from animals and plants to drive turbines that generate electricity.
*2 DCS (Distributed Control System)
A system that monitors and controls the manufacturing process or production facilities in plants and factories. To achieve even distribution of load, the DCS distributes the functions of each device over a network, resulting in safety and excellent maintainability.
*3 Per-unit energy consumption by product
= (Total amount of energy consumption for manufacturing products)÷(Quantity of products)
Learn about the customer
Mr. Toshikazu Adachi
General Manager
General Manager
Mr. Satoshi Abe
Power Supply Group Leader
Power Supply Group Leader
Mr. Satoshi Hirano
Power Supply Group
Power Supply Group
DIC Corporation KASHIMA PLANT
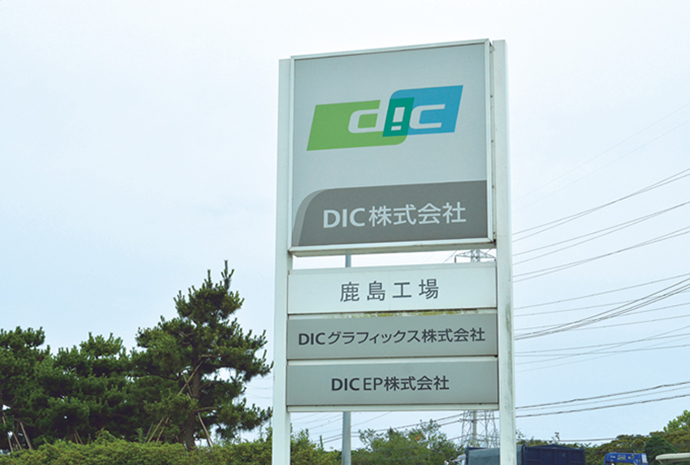
DIC Corporation KASHIMA PLANT
- Location: 18 Higashi-Fukashiba, Kamisu-shi, Ibaraki
- Start of operations: May 1972
- Business line: Manufacture of organic pigments, offset inks, functional additives, PPS (polyphenylene sulfide) resin, etc.
This case study was published in the 2014 Vol.2 issue of the azbil Group's corporate magazine, azbil.